Grid screen
The Grid is used to view the actual data that was used to generate a report. To access it, click  .
.
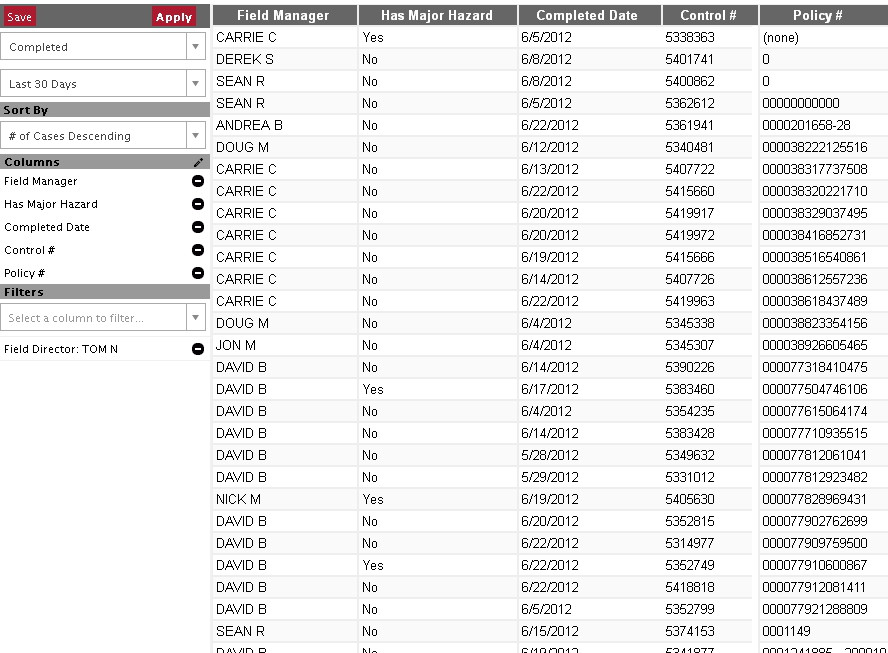
While all of the data for the report is available, it won't all be loaded at once. As you scroll down the page, additional rows will automatically be loaded and displayed.
Filters and metrics that were applied in Charts View will still be in effect in Grid View.
Note
Metrics are found in the "Sort by" drop-down in Grid View.
Working with columns
Data points are represented as a table, similar to a spreadsheet. Like a spreadsheet, you can add new columns that contain additional data.
Procedure 6. Adding a column
-
Click the
 next to "Columns" in the sidebar.
 -
Find the desired column to add in the combo box by typing into the search box or scrolling through the list.
-
Click the
 icon next to the desired column.
 -
Once all columns have been added, click the pencil icon again to close the combo box.
-
Click the
 button.
You can sort by a column by clicking the header cell for the column; clicking it again will reverse the sort order.
Exporting a CSV file
Report data points can be exported to a comma separated value (CSV) file. Many spreadsheet programs, such as Microsoft Excel and LibreOffice Calc, can open this type of file.
Figure 13. Exporting grid data
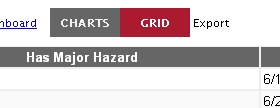
Exporting report data to a *.CSV file that can be read by Microsoft Excel.
To export report data from grid view, click  to the right of the
  . Save the
 *.csv file to your computer and open with your spreadsheet program.